Plot the data
I use matplotlib to plot the data.
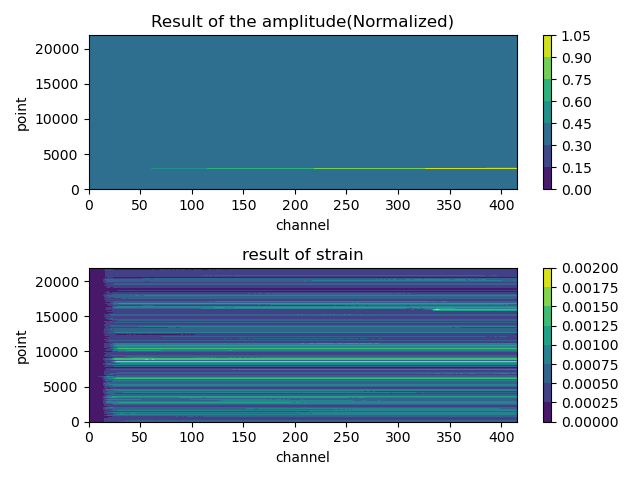
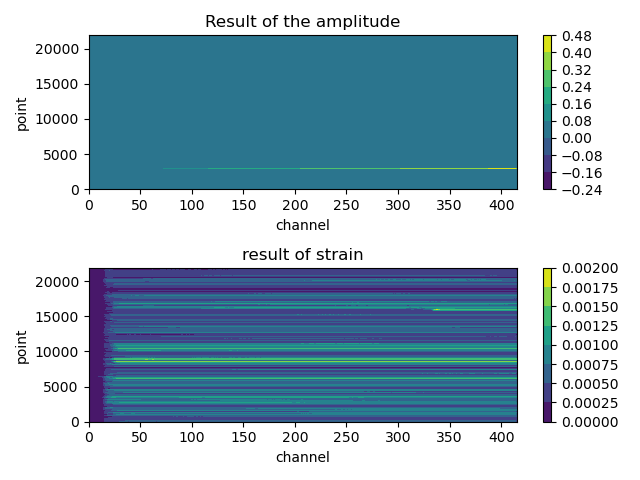
The first image is the resampled the data. And the second image is strain data, using differential with the interval 50 points of the original data.
Note that the first image’s data is normalized. Here’s a version that is not normalized.
Appendix: codes here
It is also saved in the working folder.
import matplotlib.pyplot as plt
import numpy as np

# this script is created by SY Jin, 9th Jul, 2022
# to get the plot of 10s DAS data.

file_name = "DFOS_Class_deformation_UTC-YMD20210527-HMS192431.605_seq_00000000000.hdf5"
new_name = file_name.strip(".hdf5")
output_re_sampling_txt_filename = new_name + "_resampling.txt"
output_strain_txt_filename = new_name + "_strain.txt"

data = np.loadtxt(output_re_sampling_txt_filename)
data_strain = np.loadtxt(output_strain_txt_filename)

# normalization
# data = (data - np.min(data))/(np.max(data)-np.min(data))
# data_strain = (data_strain - np.min(data_strain))/(np.max(data_strain) - np.min(data_strain))

plt.subplot(2, 1, 1)
plt.contourf(data)
plt.xlabel("channel")
plt.ylabel("point")
plt.colorbar()
plt.title("Result of the amplitude")

plt.subplot(2, 1, 2)
plt.contourf(data_strain)
plt.xlabel("channel")
plt.ylabel("point")
plt.colorbar()
plt.title("result of strain")
plt.show()
文档信息
- 本文作者:Shenyao Jin
- 本文链接:https://shenyaojin.github.io/2022/07/10/summer-research-update/
- 版权声明:自由转载-非商用-非衍生-保持署名(创意共享3.0许可证)